Isabella Kroon
Home
Portfolio
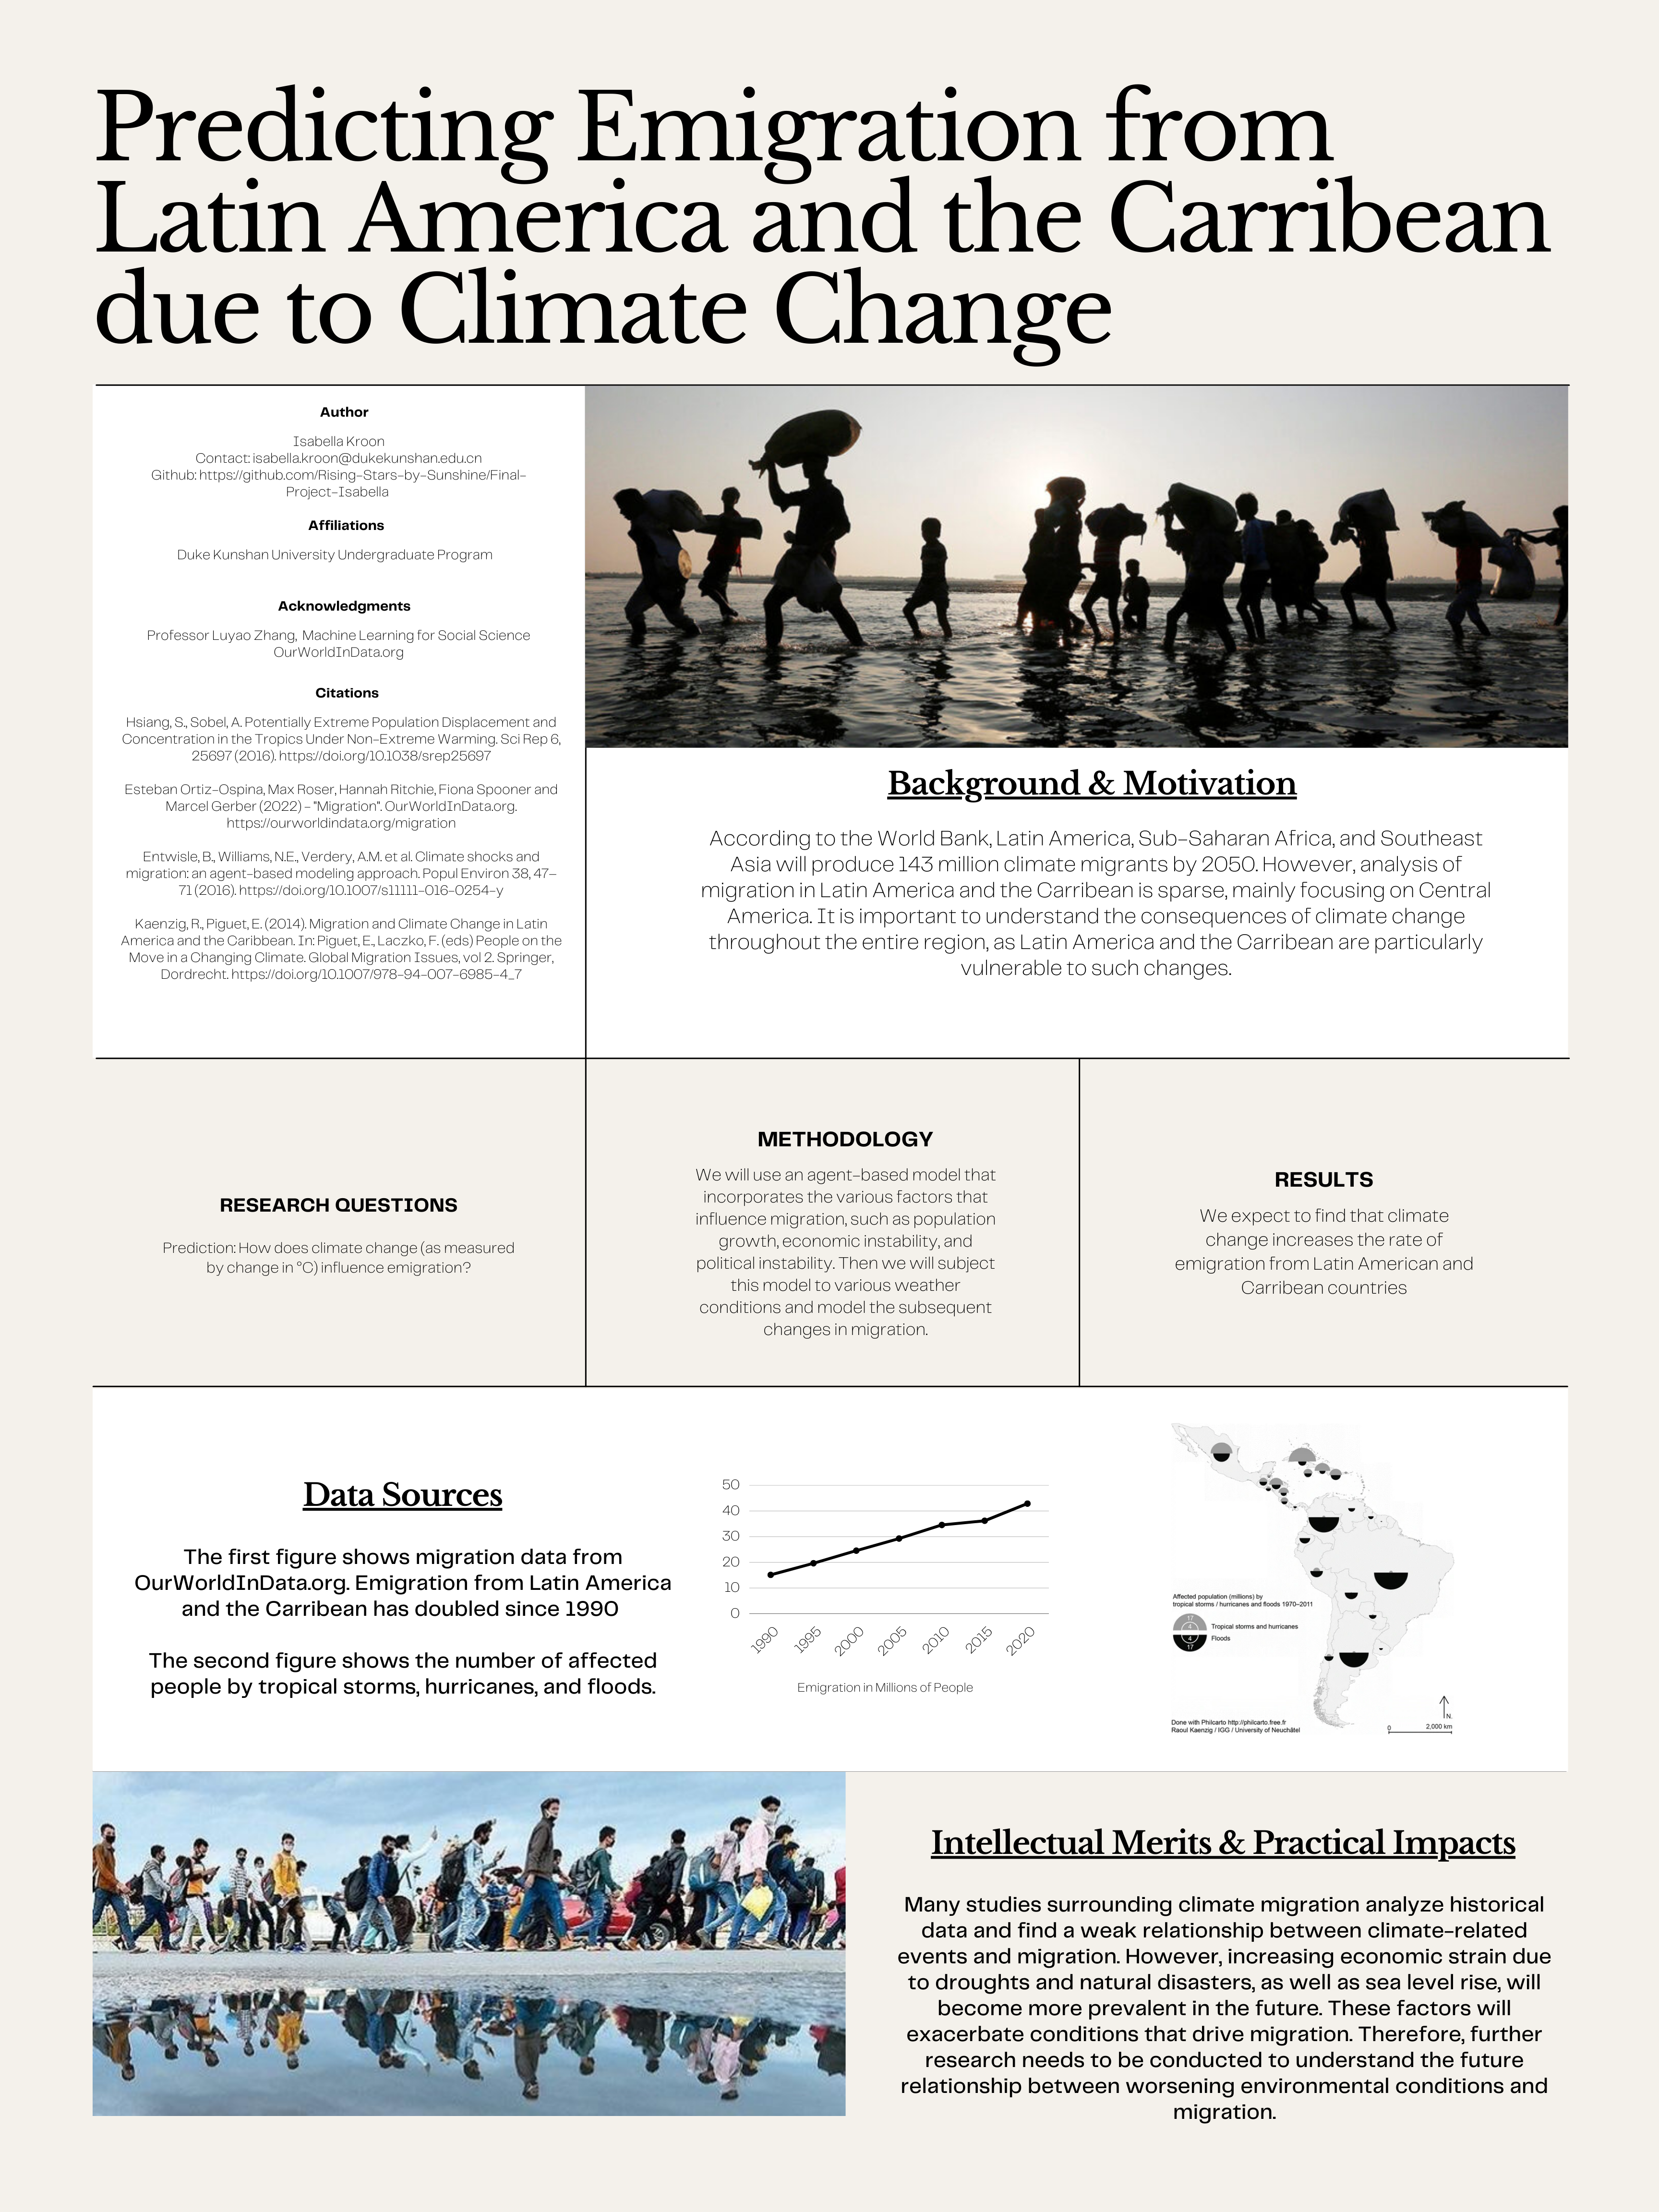
Chinese Investments in Africa
Trump on Bilibili
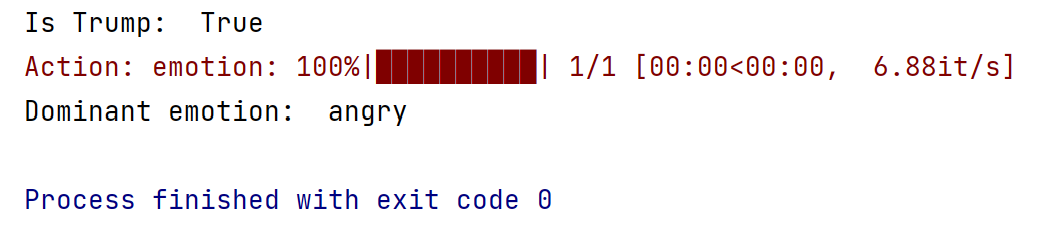
Fukushima Water
Tetris
CodeQuest Programming Game
Gallery
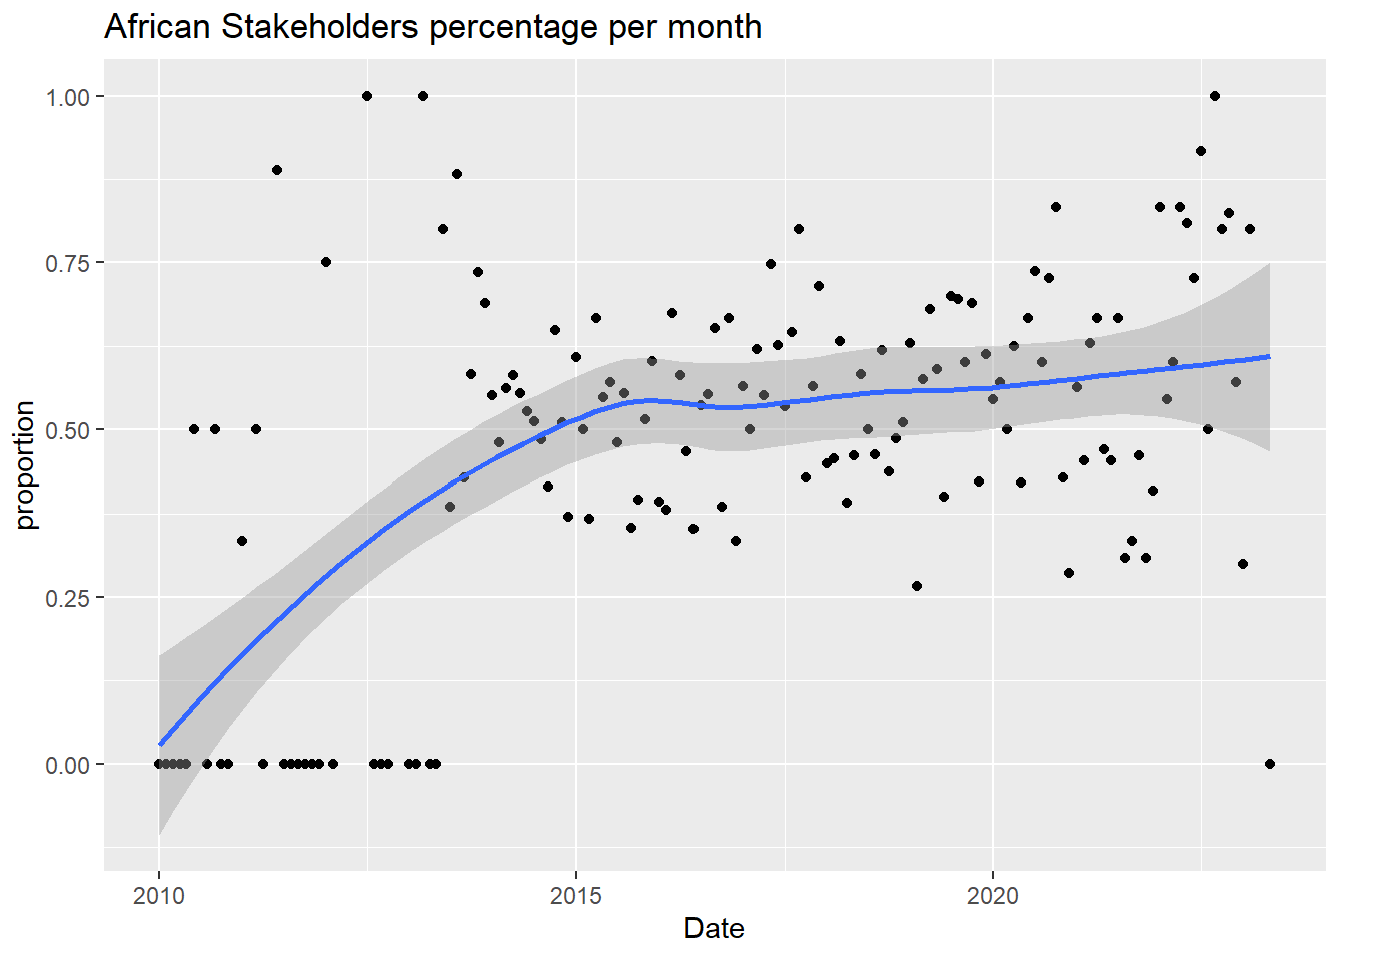
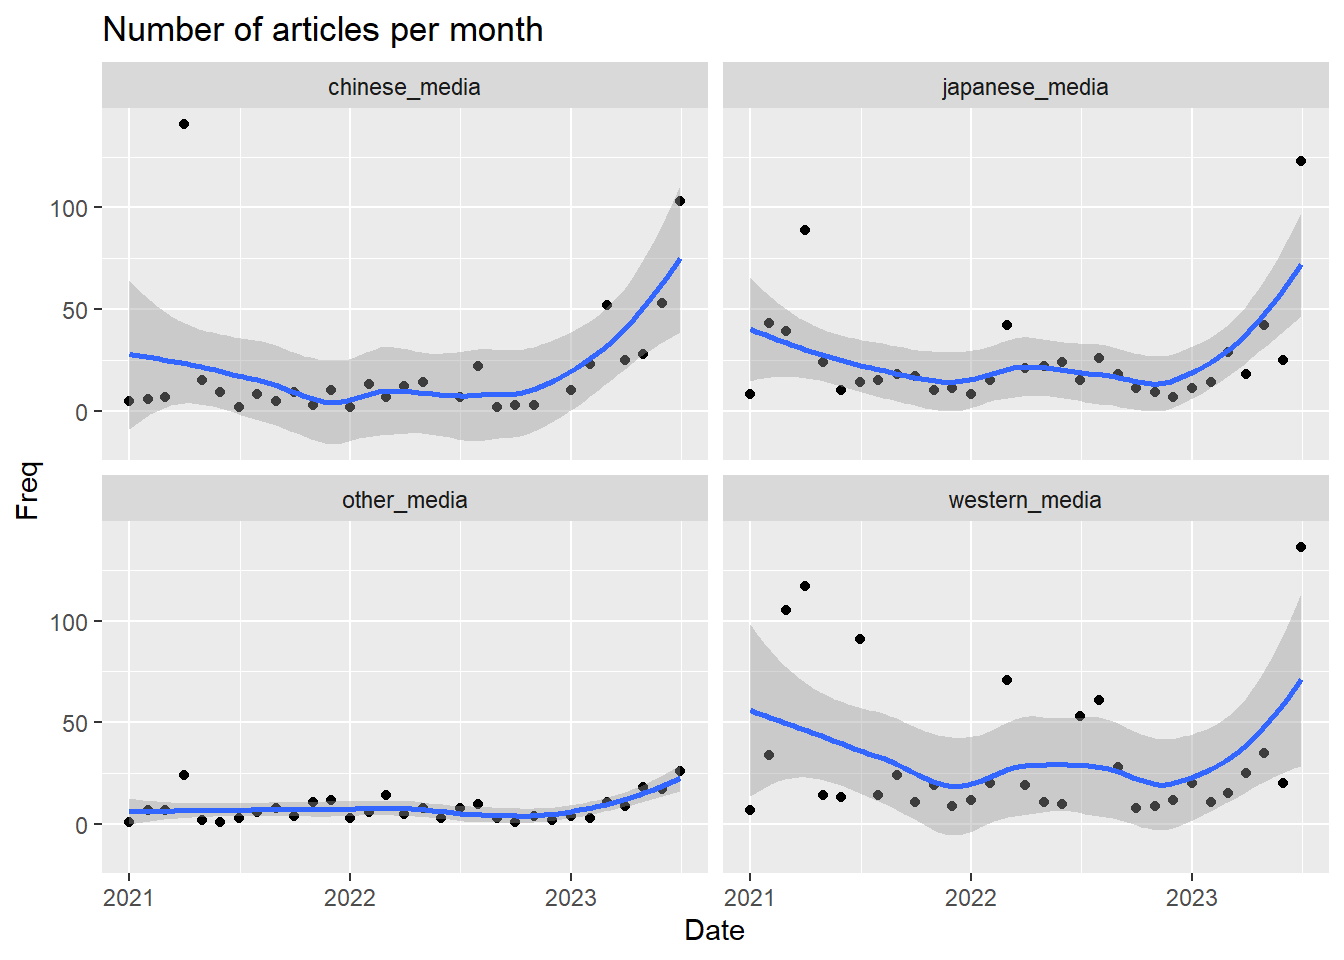
Chinese Investments: Data Visualization
Fukushima project: DeepFace AI
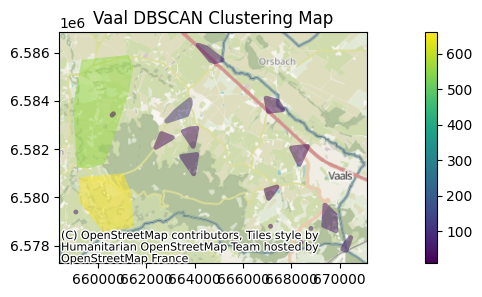
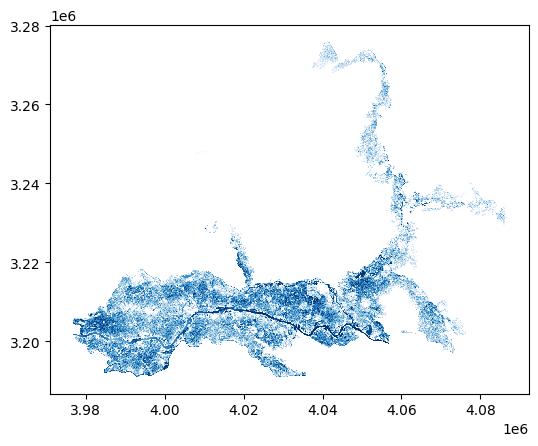
DBSCAN Density Map
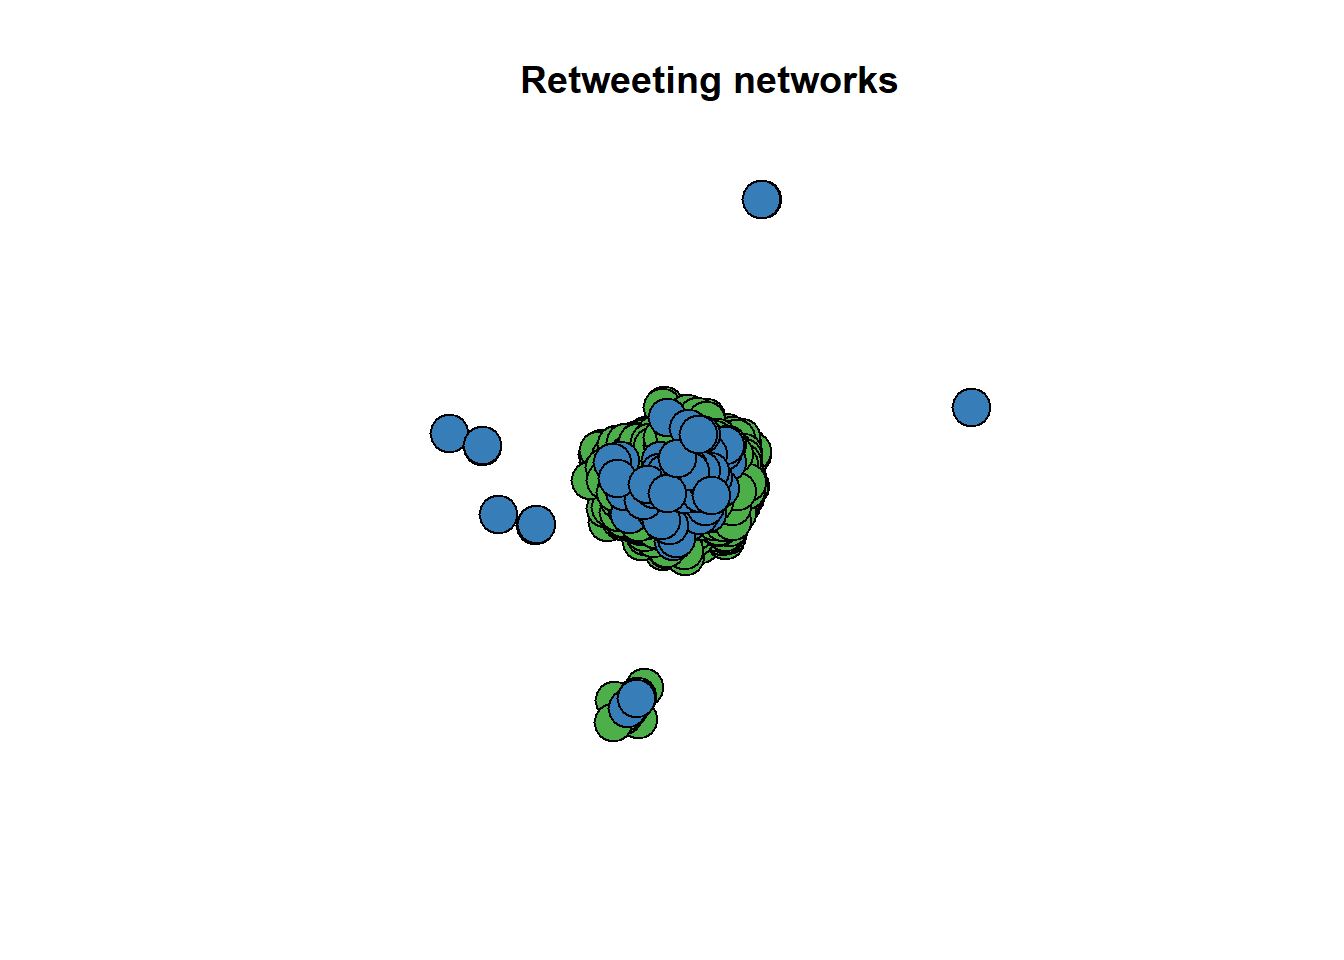
Sample Viz: Network Graph
CodeQuest project: Sample map
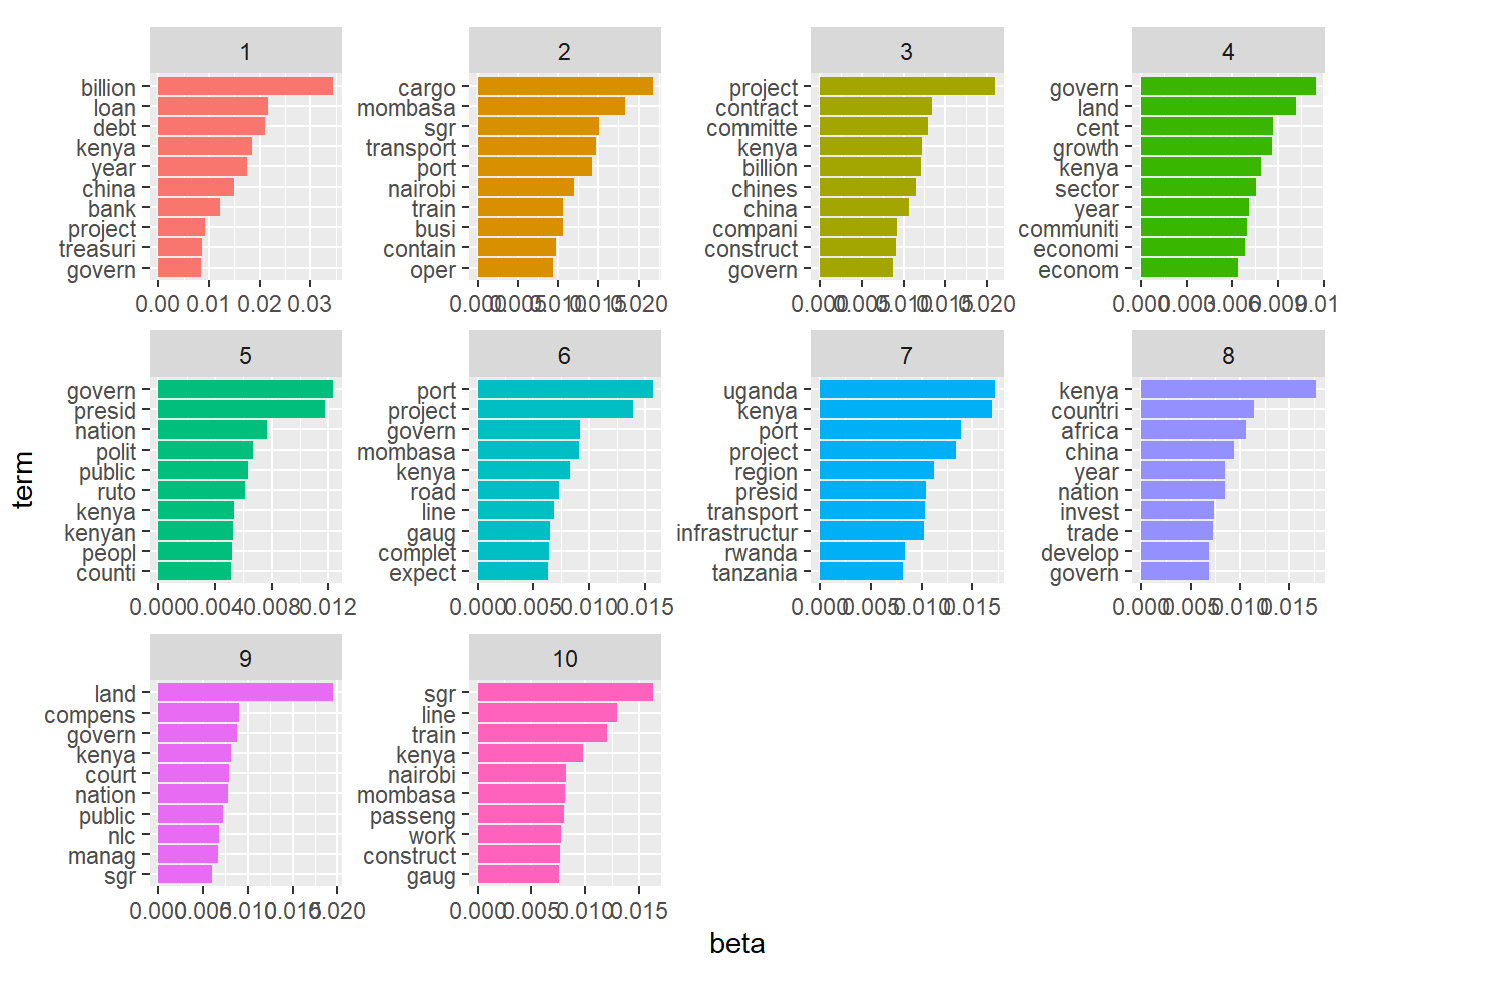
Chinese Investments: Topic Model
Flood Mapping
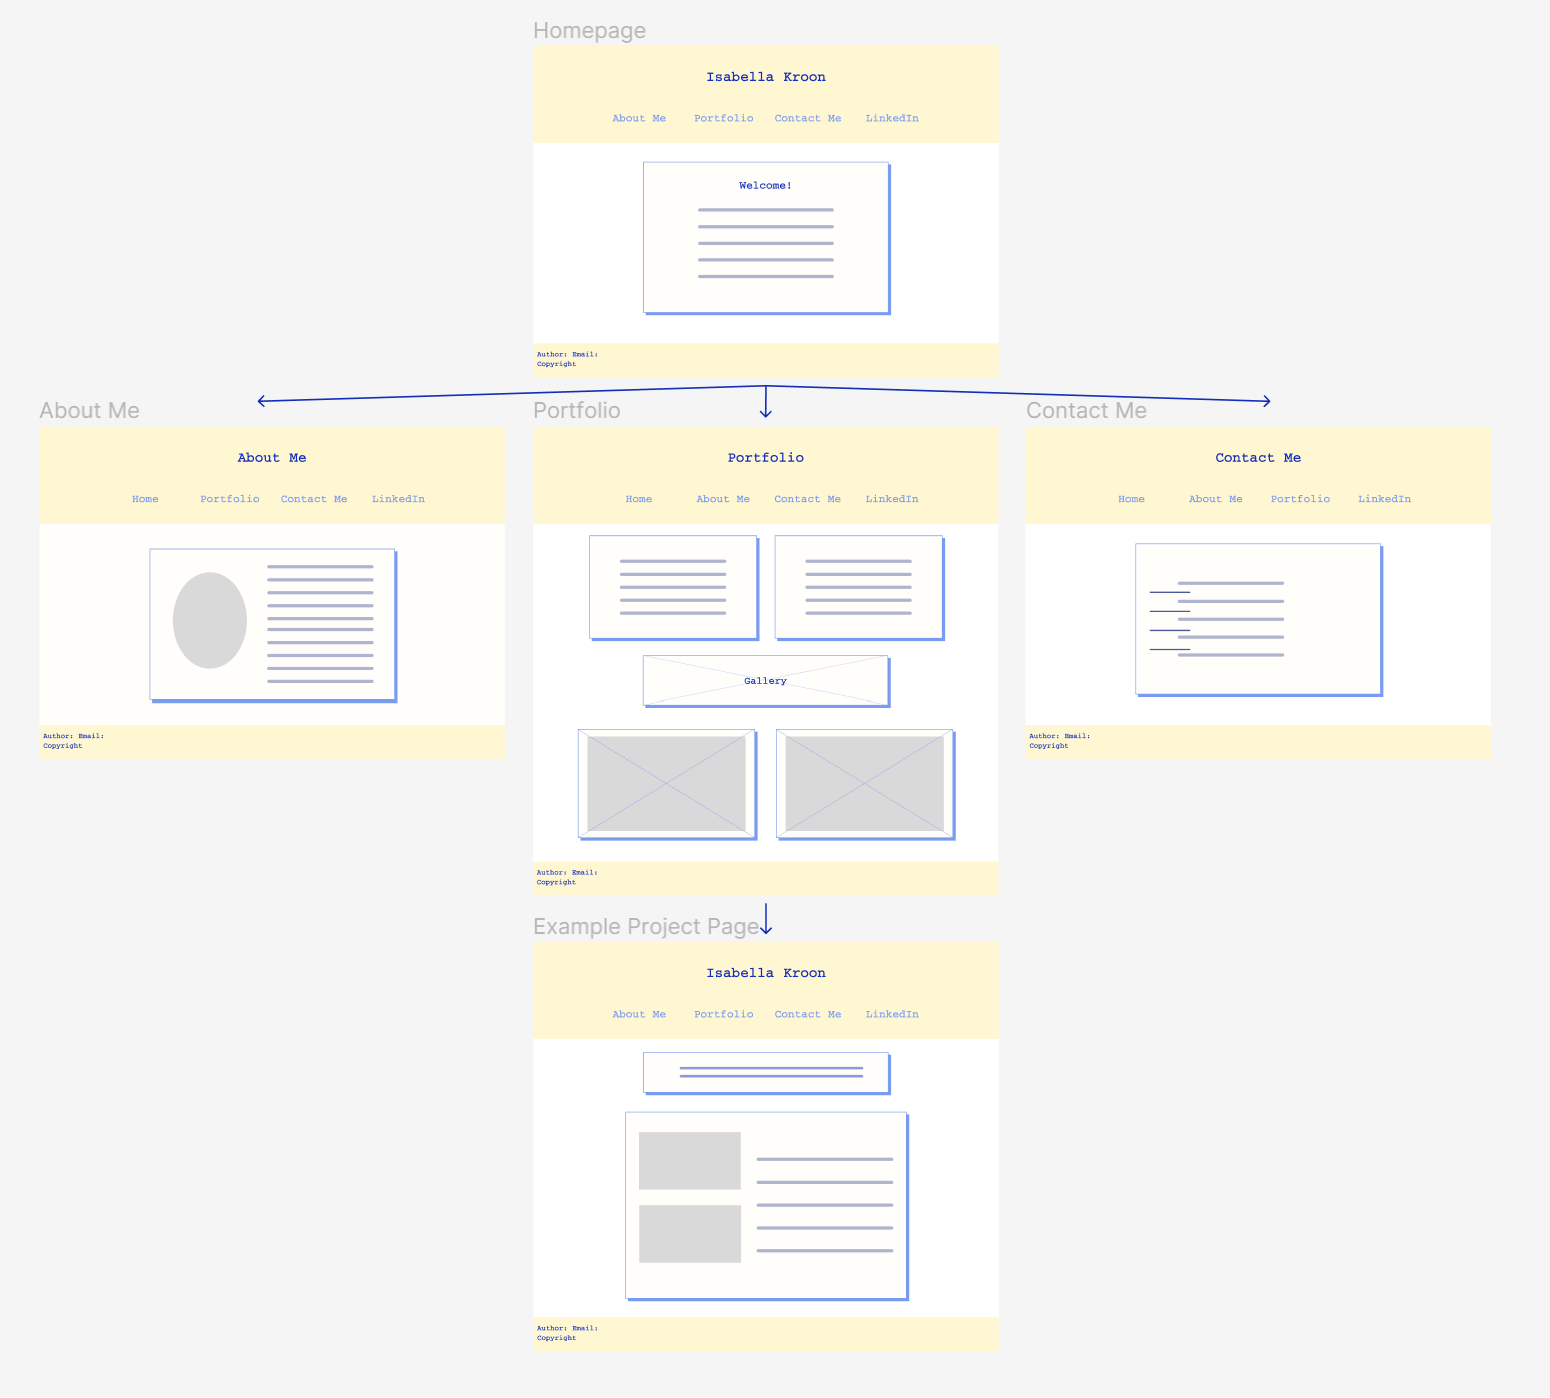
The wireframe for this website!
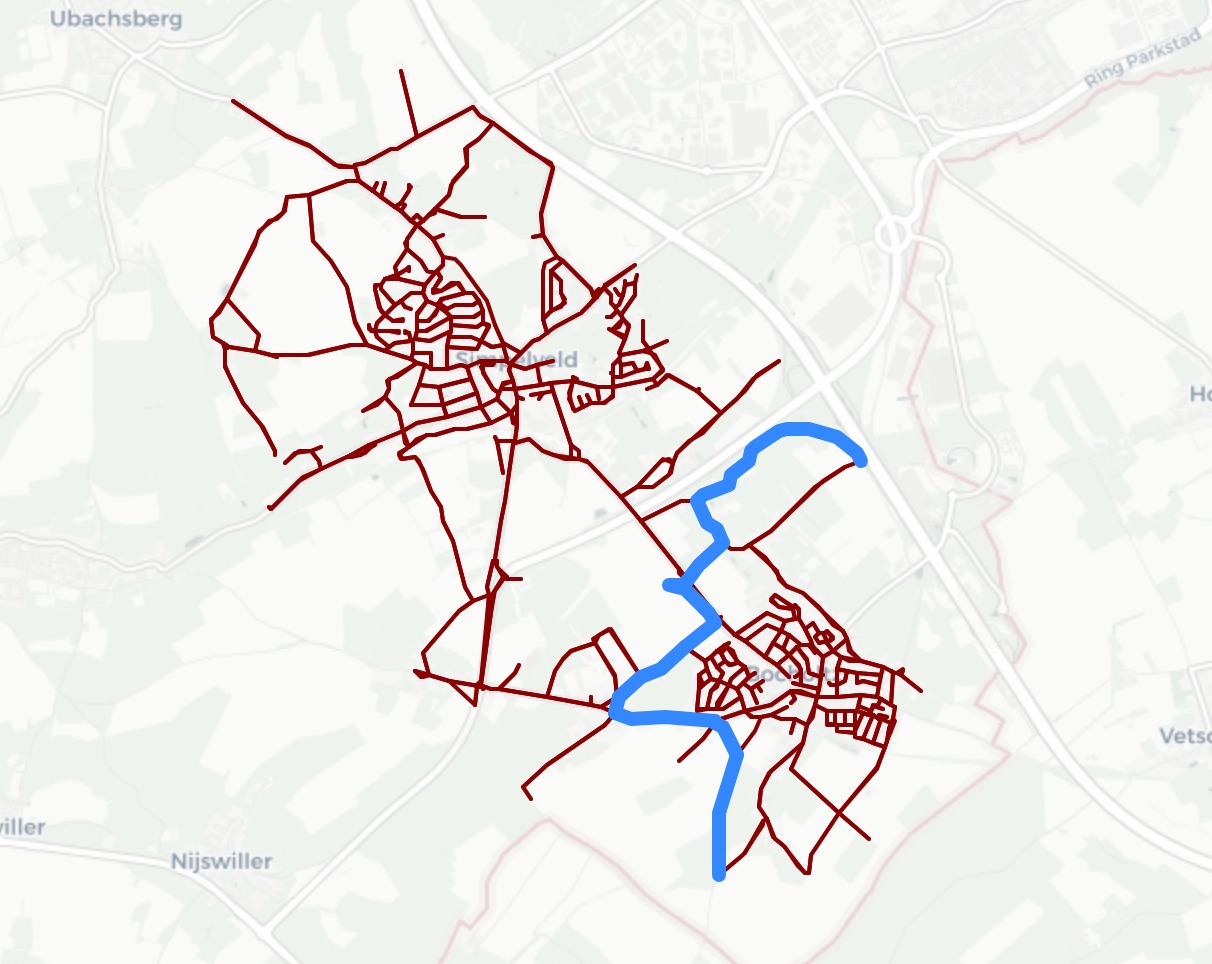
Route mapping using the Dijkstra algorithm
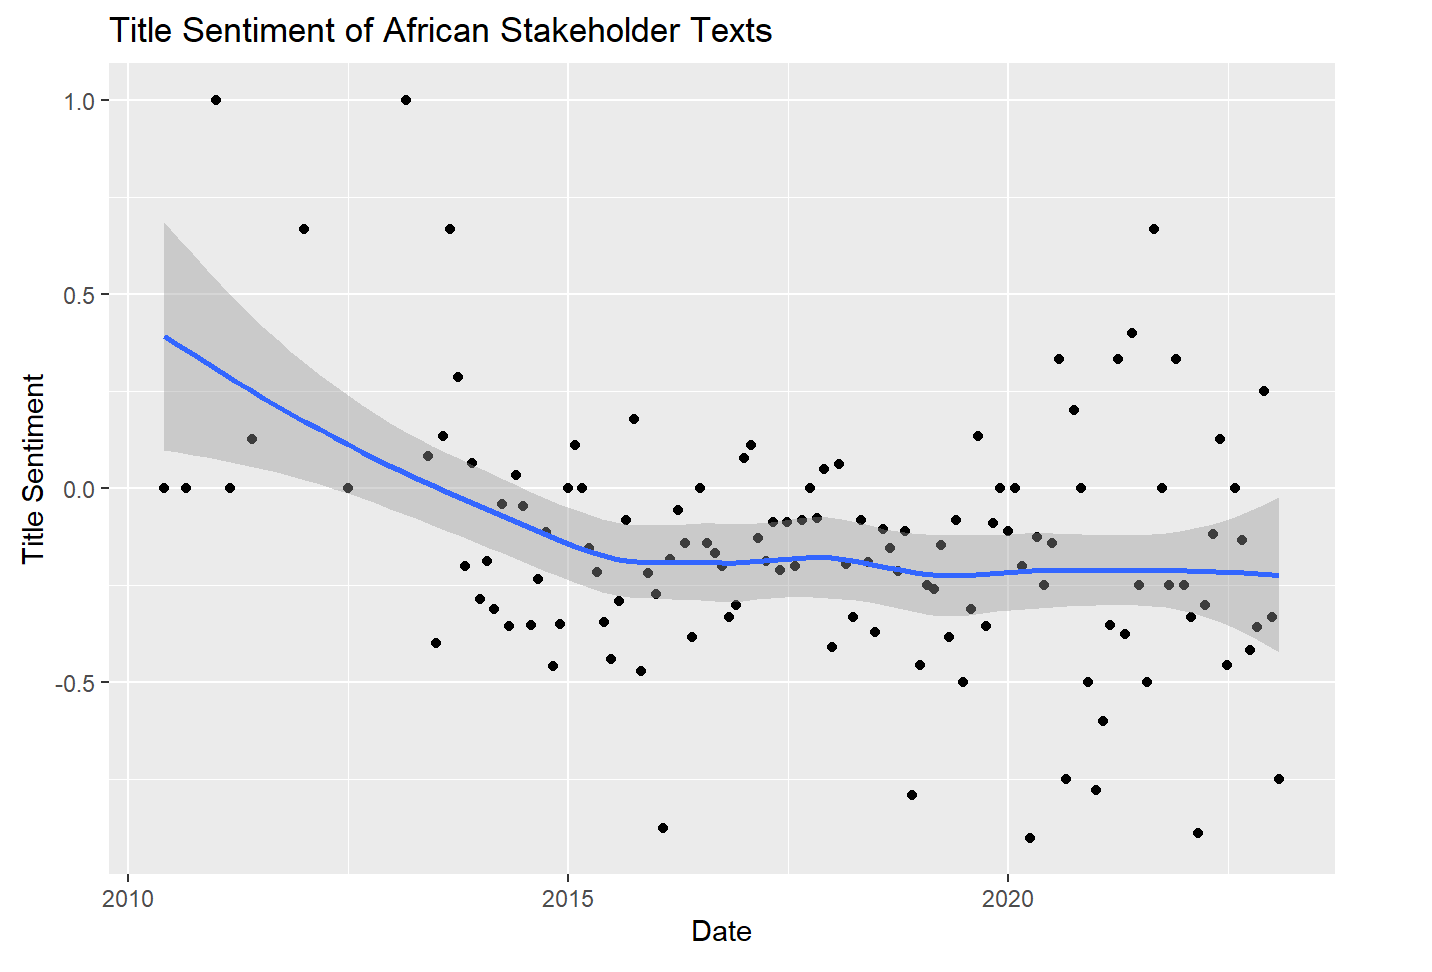
Chinese Investments: Sentiment Graph
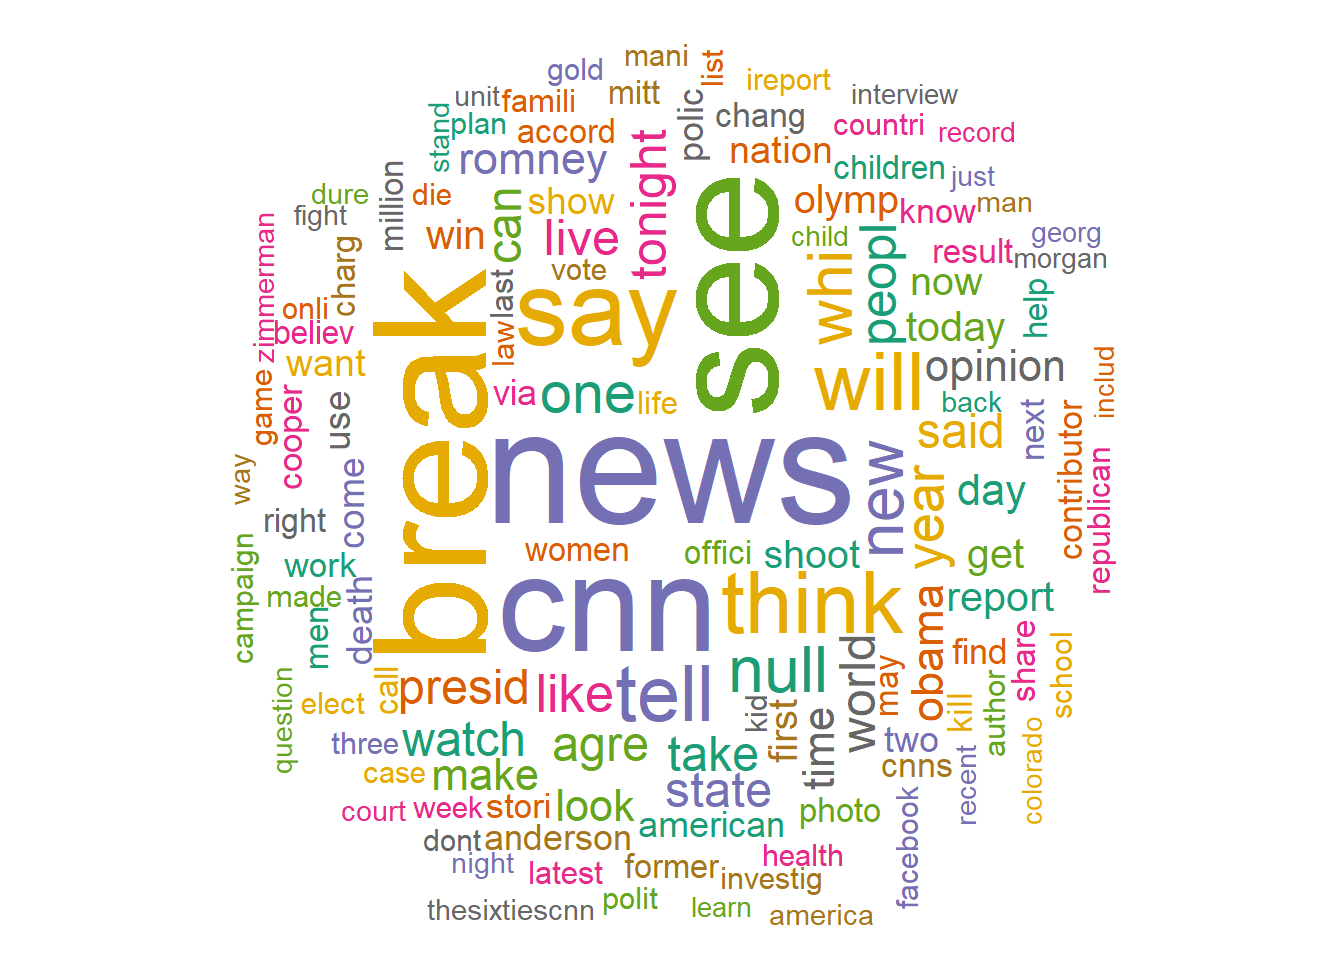
Sample Viz: Wordcloud
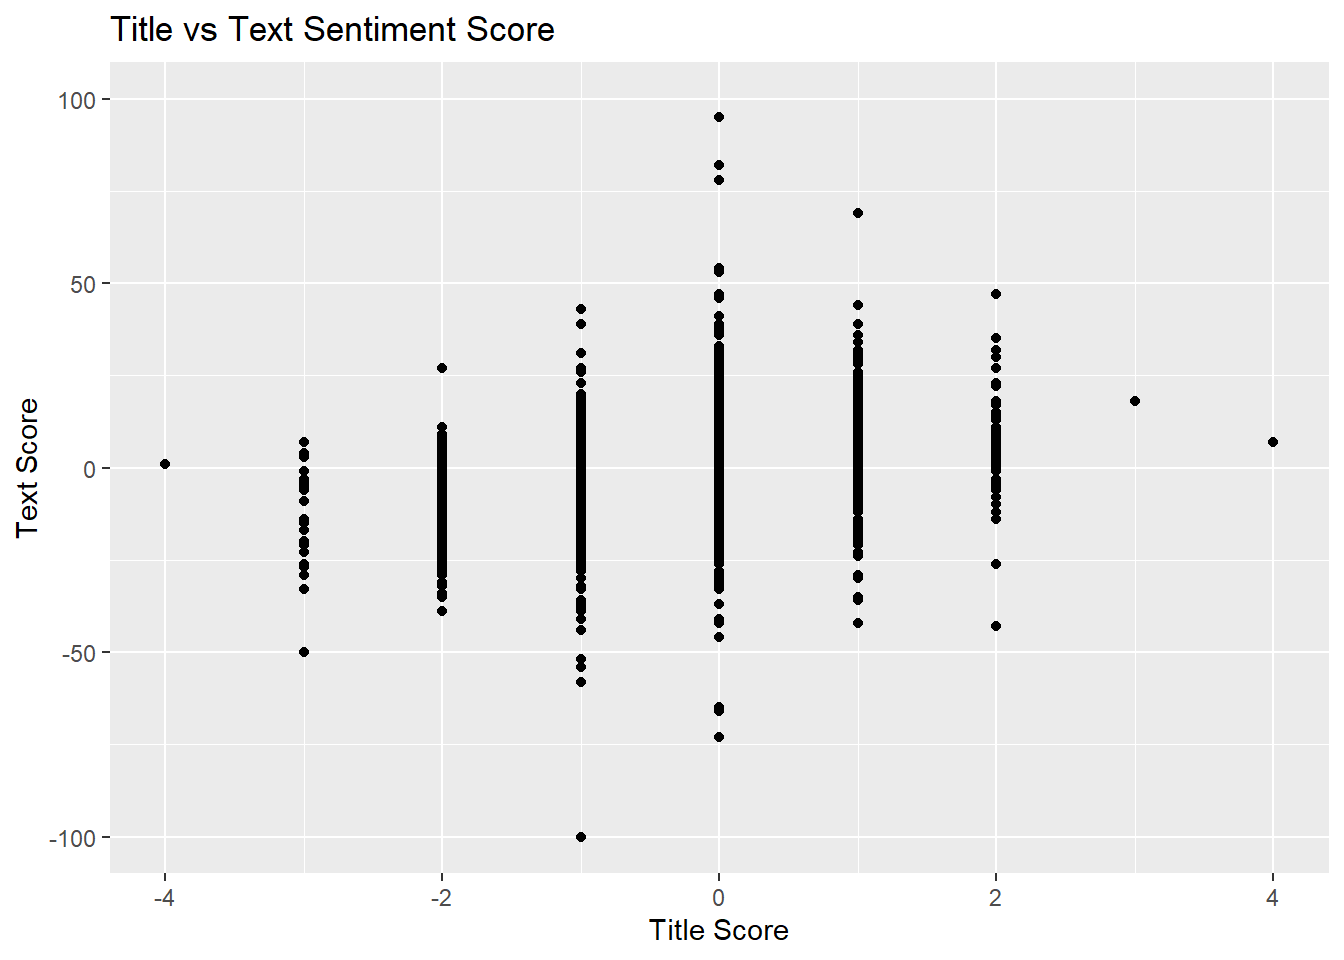
Chinese Investments: Title & Text Sentiment Analysis
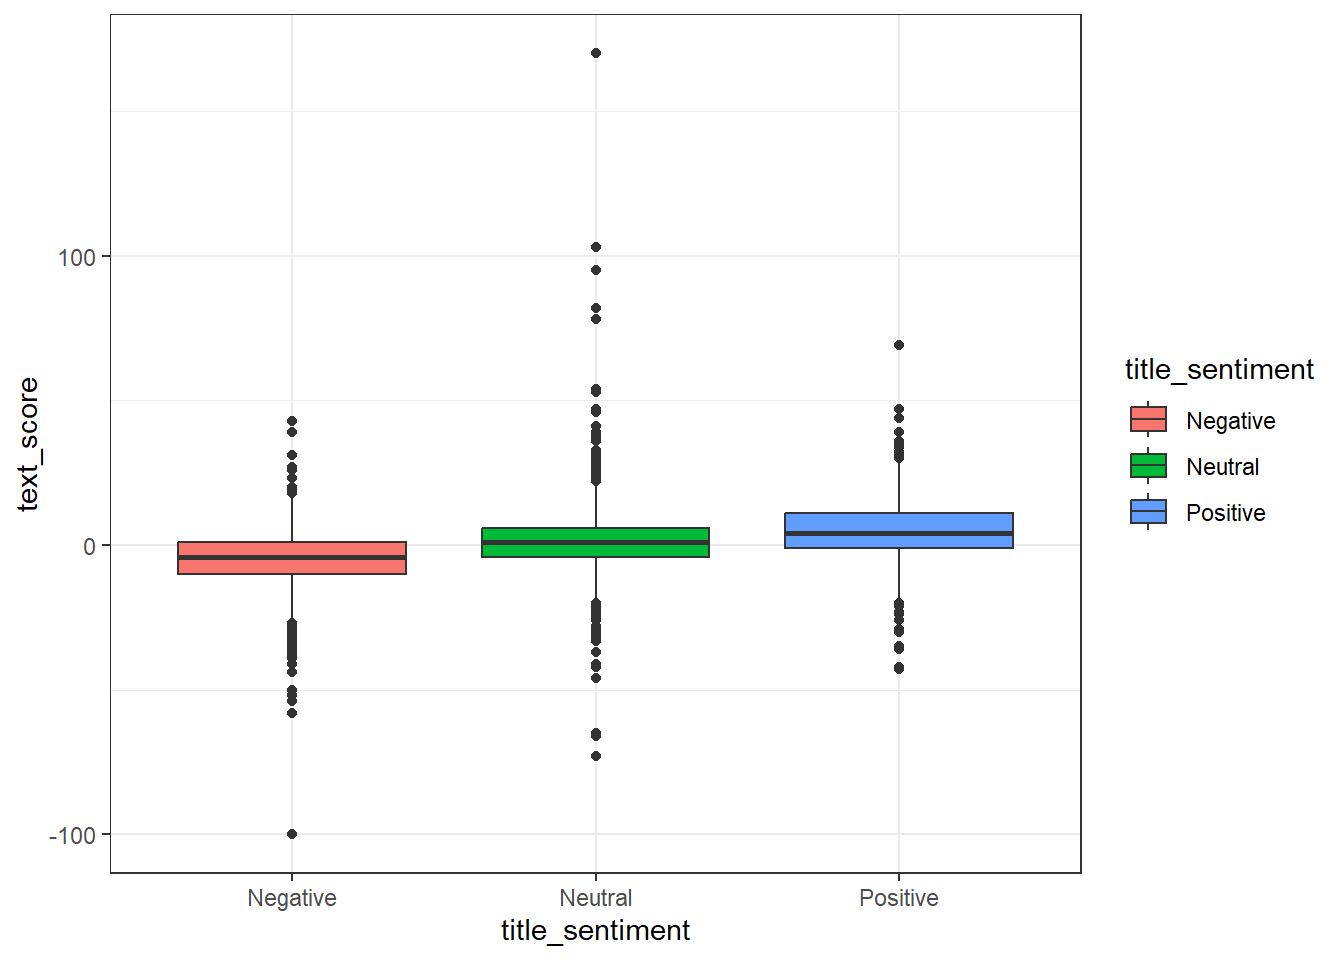
Chinese Investments: Sentiment Boxplots
Chinese Investments: Data Vizualization
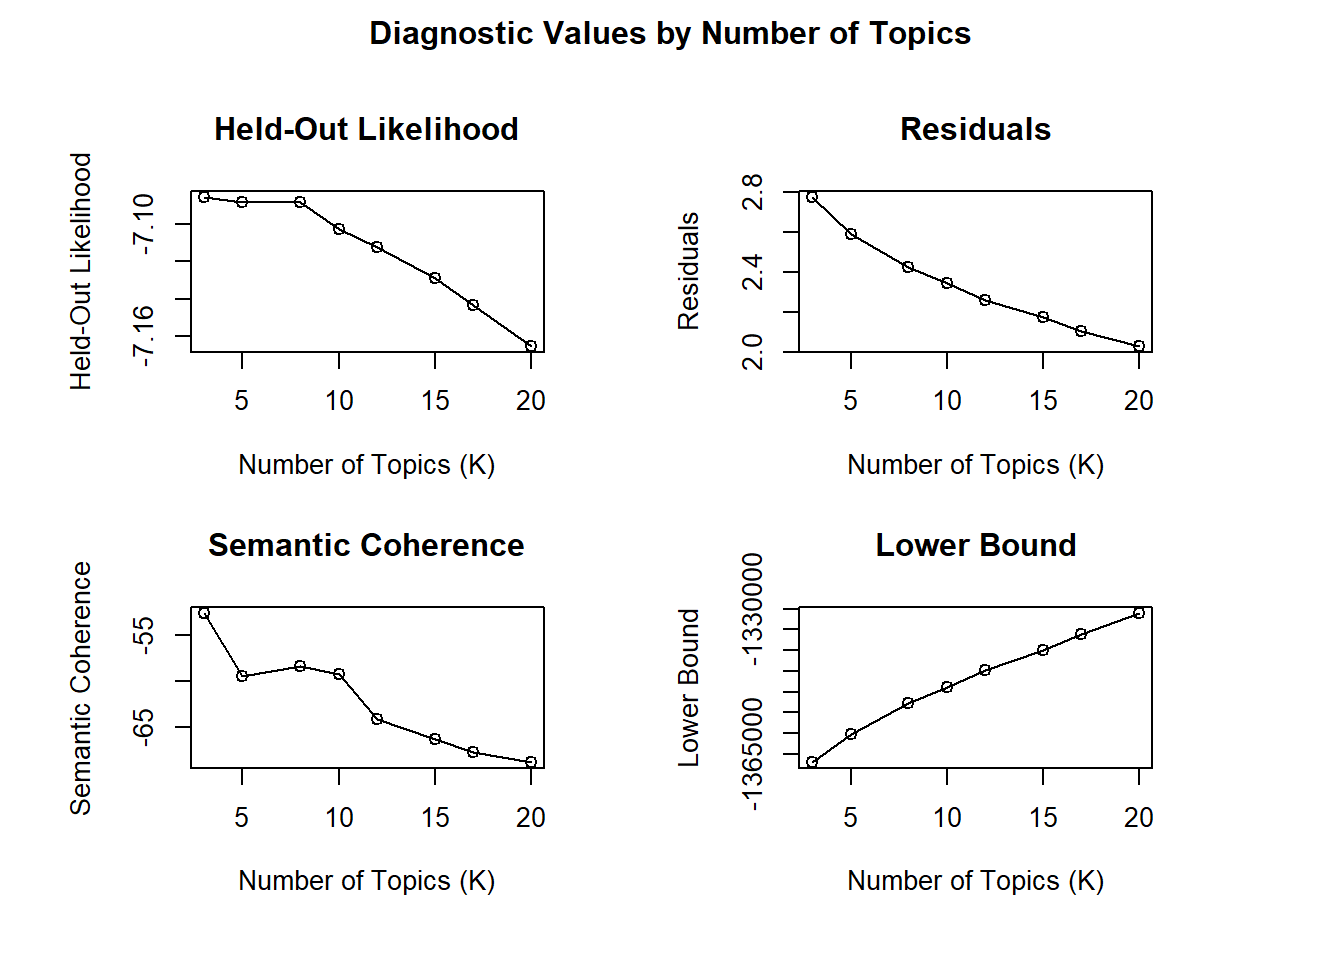
Chinese Investments: STM Diagnostic Values for Topic Model
×